
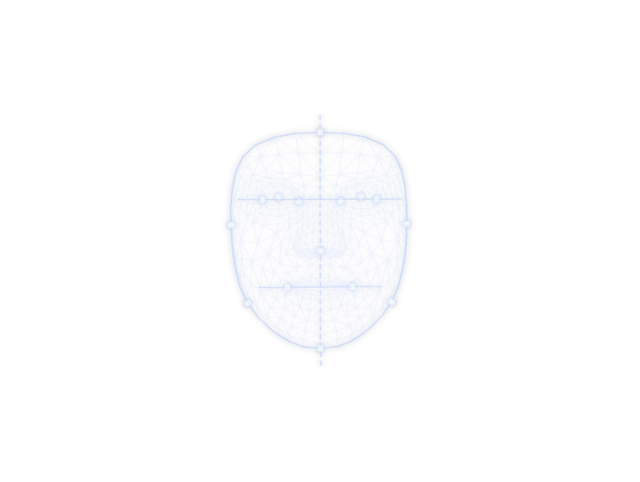
An attractiveness test estimates how your face compares with the facial patterns people tend to rate as attractive. This one places 478 landmarks on your photo, measures the proportions between them and combines four measured factors into a 1–10 score. Below the score you see every factor, its weight, the measurements behind it and the one area with the most room to improve.
The score is an app estimate from one photo. It is not a measure of your worth, and it is not a medical assessment. The photo is processed only in your browser: it is never uploaded to our servers or saved.
What the attractiveness test measures
People agree more about faces than you might expect. A large meta-analysis found that raters agree about who is and is not attractive, both within and across cultures (Langlois et al., 2000). A later review found that averageness, symmetry and sexual dimorphism are attractive in both male and female faces and across cultures (Rhodes, 2006).
Newer work separates those factors. In a 2025 study that measured all three from real face photos, averageness predicted ratings for men and women and femininity predicted ratings for women, but masculinity and symmetry did not (Lee et al., 2025). Other research adds two factors that are not about shape at all: facial fat and skin.
The test uses Google's MediaPipe Face Landmarker, which estimates 478 three-dimensional face landmarks from one image. From those points it can measure shape. It cannot see skin texture or how much fat sits under the skin.
| Factor | What it means | Measured from your photo? |
|---|---|---|
| Averageness | How close your proportions are to a typical face | Yes, 7 ratios |
| Feature placement | Eye tilt, nose tip and mouth corner centering | Yes |
| Jaw proportion (men) | Jaw width next to cheek width | Yes |
| Symmetry | How closely the left and right sides mirror | Yes |
| Femininity (women) | Sex-typical shape in female faces | No |
| Facial fat | How lean or full the face looks | No |
| Skin evenness | Tone and texture | No |
How the score is calculated
The score uses the same measurement engine as the LooksLab app. Each factor gets a score from 0 to 100 and a fixed weight. The weights follow how strongly each factor relates to ratings in the research above, so averageness carries the most and symmetry very little.
| Factor | Weight for men | Weight for women |
|---|---|---|
| Averageness | 50% | 45% |
| Facial fat | 15% (not measured) | 20% (not measured) |
| Skin evenness | 15% (not measured) | 12% (not measured) |
| Feature placement | 10% | 3% |
| Jaw proportion / femininity | 5% | 15% (not measured) |
| Symmetry | 5% | 5% |
A front photo can measure 70% of the formula for men and 53% for women. The parts it cannot measure are shown as "not measured" and left out. They are not filled in with a guess.
Averageness (50% for men, 45% for women). Averageness means closeness to the typical face, not an ordinary face: composite faces made by averaging many photos were rated more attractive than almost all of the faces in them (Langlois and Roggman, 1990). The test measures five ratios built from eye, nose, mouth and face-height distances and compares them with published values for young adults of your sex from nine population groups (Farkas et al., 2005). It uses the group whose typical values are closest to your face, so a face is not marked down for being far from one group's average. This is not an ethnicity guess, and those reference samples are small: the authors call the study preliminary. Two more ratios, upper to lower lip and middle to lower face height, are compared with typical values. A face whose ratios sit on average one standard deviation from typical scores about 60; two standard deviations score about 20.
Feature placement (10% for men, 3% for women). This averages three checks: how centered the nose tip is, how level the mouth corners are, and your eye tilt compared with a typical +4°. A more positive tilt scores higher. The canthal tilt test shows that angle for each eye.
Jaw proportion (men only, 5%). This compares jaw width with cheek width against a typical 0.75. It rewards being close to typical, not a wider jaw, because the 2025 study above found no link between masculinity and ratings of men's faces. A jaw wider than typical therefore lowers this factor a little, but the result never calls it a weakness. For women this slot is femininity (15%), which the test does not measure yet.
Symmetry (5%). The test compares mirror pairs across your midline in four groups: pupils, brows, inner and outer eye corners, and mouth corners with jaw corners. The average is scored against a typical 88%. It has a small weight because a meta-analysis found strong signs of publication bias in research on symmetry and attractiveness: correcting for it cut effect sizes by 30–50%, and in the few studies with more than 100 participants the effects were nearly zero (Van Dongen, 2011). The face symmetry test measures about 70 mirror pairs, region by region.
From factors to the 1–10 scale. The score is the weighted average of the measured factors, divided by the measured weight. That result is placed on a curve: 68 maps to 6.0, about where an average face lands. Every 12 points above 68 adds 1.7, every 12 points below takes away 1.15, and the scale runs from 2.0 to 9.9.
Worked example from one of our sample faces, scored with men's ranges: averageness 90, placement 87, jaw proportion 59, symmetry 99. That gives (50% × 90 + 10% × 87 + 5% × 59 + 5% × 99) ÷ 70% = 88, which maps to 8.8. Your own result shows this sum with your numbers in it.
Some tools score faces against the golden ratio of 1.618. We do not. When researchers moved the eyes and mouth on the same faces, the most attractive positions matched the proportions of an average face, not 1.618 (Pallett et al., 2010). The golden ratio face calculator shows your ratios next to 1.618 if you want to compare.
What your score means
The engine is tuned on reference faces so that an average face scores about 6. The band next to your score comes from the same curve:
| Score | Band | How to read it |
|---|---|---|
| 4.8 or lower | Below typical | Proportions further from typical, or a photo problem. Retake the photo before you read into it. |
| 4.9–7.6 | Typical range | Close to the average of the reference faces |
| 7.7–9.3 | Above typical | Measured proportions close to typical on most factors |
| 9.4 and up | Standout | Rare on this curve |
The tuning comes from reference faces, not from a large set of real scans, so the test does not rank you against other people. It also cannot be compared with scores from other apps, because each one uses its own measurements and scale. The PSL scale test translates this same score onto the scale used in looksmaxxing forums.
The factor scores are more useful than the total. Two faces with the same total can have very different factor scores, and the factors tell you where the number comes from.
How your biggest opportunity is chosen
Every measurement has a direction. For symmetry, eye tilt and nose and mouth centering, higher is better, so only a value below typical can count against you. For most averageness proportions, closer to typical is better on both sides. Some differences lean toward the typical face of your sex and are never called a weakness: a jaw wider than typical or a longer lower third in a man, and a shorter lower third, a narrower nose base or a shorter nose in a woman. The 2025 study above found that femininity predicted higher ratings for women and masculinity did not predict lower ratings for men. Larger eyes are not called a weakness for anyone.
The tool scores each measured factor again with only those unfavorable differences counted. The factor with the lowest of these scores is your opportunity, and the result names its measurement with the largest unfavorable difference, such as eye spacing, nose centering or lip balance. If that measurement is still inside the typical range, the result says so. If your head is turned, symmetry is skipped, because a turned head lowers it sharply even when the face itself is symmetric. If every measured factor scores 80 or more, the result says there is no measured weakness and points to the largest parts the photo cannot measure: facial fat and skin evenness.
The directions decide only what is called a weakness. They do not change the score: the jaw factor still scores closeness to typical, so a very wide jaw lowers a man's score slightly, within its 5% weight.
Each opportunity points to what you can influence. For a proportion, that means framing and a better photo: hair, brows, facial hair and a leaner face change how fixed proportions read, and a close camera or a tilted head changes several ratios. For eye tilt it means the eye area: brow shape, sleep and under-eye care. For a narrow jaw it means facial fat and a haircut or beard chosen for your shape. Jaw workouts do not reshape the jaw: in a six-month jaw training trial, the bite got stronger but jaw shape did not change.
Why your score changes between photos
The test measures your photo, and the photo is not a perfect copy of your face. Small changes in how the photo is taken can move the score more than a real change in your face:
| Photo problem | What it changes |
|---|---|
| Phone close to your face | At about 12 inches, a selfie makes the nose base look about 30% wider, relative to face width, than a distant photo does (Ward et al., 2018). That moves the nose-width ratio in averageness. |
| Head turned slightly | Lowers symmetry and changes the nose tip and mouth centering |
| Head tilted up or down | Changes the face-height ratios and the eye tilt |
| Smile or open mouth | Changes the lip ratio and mouth corner balance |
| Light from one side | Shadows make landmarks on the darker side harder to place |
| Beauty filter or face-editing app | Changes the geometry the test measures |
The tool refuses side views, and it tells you when your head is turned or tilted enough to make the result less reliable.
For a result you can trust, hold the camera at eye level and at arm's length or farther, face it straight on with a relaxed expression, keep hair off your face and use soft, even light from the front. Our guide to taking photos for face analysis has the full checklist. When you take the test again later, use the same setup, or you compare two photo setups instead of two versions of your face.
What a photo test cannot see
Shared standards explain only part of how people rate faces. In three experiments, personal taste was about as powerful as shared taste in judgments of facial attractiveness (Hönekopp, 2006). No single score can predict how one particular person sees you.
A still photo also leaves out how your face moves when you talk and smile, your voice, your style and how you carry yourself. This test does not try to measure any of them.
What can change and what cannot
Bone sets most of what this test measures: the spacing of your eyes, the width of your nose base, the length of your lower face. A routine does not change those, and nothing on this page promises that it will.
Other parts of how a face is rated can change:
- Facial fat. Perceived facial adiposity predicts ratings of health and attractiveness (Coetzee et al., 2009), and a meta-analysis found that people can estimate body mass from the face alone (r = 0.71) (de Jager et al., 2018). A leaner face also shows the jaw and cheekbones more clearly.
- Skin evenness. More even skin made faces look more attractive in experiments, even when viewers did not notice that the skin had changed (Sun et al., 2022).
- Sleep. The same people were rated less attractive and less healthy after 31 hours without sleep than after a normal night's sleep (Axelsson et al., 2010).
- Grooming. Hairstyle, brow shape and facial hair do not move bone, but they change how the proportions around them read. The face shape detector is a good start for choosing a haircut or beard.
Facial fat and skin together are 30% of the formula for men and 32% for women, and this photo test measures neither. Working on them without surgery is what forums call softmaxxing; this 12-week softmaxxing plan orders the changes by how long each takes to show. If facial fat is your main goal, how to lose face fat shows how much weight it takes before the face changes. For women, the female looksmaxxing guide puts these levers in a 12-week order with makeup and hair. The LooksLab app builds a routine around the areas your result points to, including skin and jawline, with progress scans over time.
Frequently asked questions
How attractive am I on a scale of 1 to 10?
This test gives a measured estimate on a 1–10 scale. It is tuned so an average face scores about 6, and the typical range runs from 4.9 to 7.6. The number comes from the geometry of one photo, so read it together with the factor scores and take it again in better light before you trust a surprising result.
How do I know if I am attractive?
People agree about faces more than you might expect, so the patterns they respond to can be measured: averageness, symmetry, sex-typical features, skin and facial fat. A photo test like this one measures the shape factors and shows each one. It cannot measure personal taste, which research finds is about as strong as shared taste, or your expression, voice and style. Use the score as one piece of information, not a verdict.
Are attractiveness tests accurate?
They can measure the parts of a face that research links to ratings, such as averageness and symmetry, and a measured test like this one gives the same photo the same score every time. They cannot measure skin, facial fat, expression or anything outside the photo, and a close camera or a tilted head changes the numbers. Treat a single score as an estimate, and compare photos taken the same way.
What is the most accurate attractiveness test?
Accuracy is hard to judge, because few tests publish how their scores compare with ratings from real people, and LooksLab has no such data yet. What you can check is the method. Does the test show how the score is built? Does the same photo get the same score? Does it say what it cannot measure? This test shows every factor, weight and measurement, and it leaves skin and facial fat out instead of guessing.
Can AI tell how attractive I am?
AI can measure a face in a photo and turn the measurements into a score, but it can only estimate the patterns many people share, not how one particular person will see you. This test uses Google's MediaPipe to place 478 landmarks, then applies a fixed formula that is shown in full on this page. It is not a model trained to copy human ratings, and it does not see skin, expression or style.
Is the ChatGPT attractiveness test accurate?
A chat assistant that rates your photo gives a written opinion, not a measurement. It does not show a formula, and asking again about the same photo can give a different number. A measured test gives the same photo the same score and shows where the number comes from. If you use a chatbot, treat its rating as a guess and compare it with a measured test and a well-taken photo.
What is a good attractiveness score?
On this test, 6 is about average and anything from 7.7 up is above the typical range. Scales are different between apps, so a 7 here is not the same as a 7 elsewhere. The factor scores tell you more than the total: they show what pulls the number up and what holds it back.
Why do I look different in photos than in the mirror?
You mostly see yourself mirrored, while other people and cameras see the unflipped face. In a classic study of 33 women, the women tended to prefer their mirror image, while their close friends preferred the true image (Mita and colleagues, 1977). A phone held close to your face also makes the nose look wider than it is. Both effects can make a photo look less like the face you know.
Why did I get a different score on another app or photo?
Each app uses its own measurements, reference data, weights and scale, so scores from different apps cannot be compared. On the same app, a different score usually means a different photo setup: camera distance, head angle, light or expression. Use the same setup each time if you want to track changes.
Does the attractiveness test work for men and women?
Yes. You choose men's or women's ranges because typical face proportions differ between the sexes, and so do the factors linked to ratings. The choice sets the reference values and the weights. For men, jaw proportion is measured. For women, the femininity factor is not measured yet, so a front photo covers 53% of the formula instead of 70%. You can switch on the result screen to see both.
Can I improve my attractiveness score?
The parts set by bone, such as the width between your eyes, do not change with a routine. Facial fat, skin evenness, sleep and grooming can change, and research links the first three to how faces are rated. This test cannot measure skin or facial fat, so a better photo setup is the only fast way to move the number here.
What makes a face attractive according to science?
Research points to a few shared factors. Faces close to the average of many faces are rated more attractive, and averageness, symmetry and sex-typical features are attractive across cultures. Newer work with measured faces finds that averageness matters most, femininity helps women's ratings and symmetry adds little. Skin evenness and facial fat matter too. This test follows that evidence: averageness carries 45–50% of the formula and symmetry only 5%.
Does the golden ratio make a face attractive?
Not as a rule. When researchers moved the eyes and mouth on the same faces, the most attractive positions matched the proportions of an average face, not 1.618. That is why this test leaves the golden ratio out of its score. If you want to see your ratios next to 1.618 anyway, the LooksLab golden ratio face calculator shows them.
Can an attractiveness test rate my side profile?
This one cannot. It measures a front photo and refuses side views, because eye spacing, nose width, centering and symmetry need both sides of the face in view. A profile needs different measurements, such as how far the chin and nose project, and this test does not score them. For the best result, face the camera straight on with your head level.
Is this attractiveness test free?
Yes. The test, the full formula and your result are free, with no account or sign-up. Your photo is measured in your browser and is not uploaded or saved. The LooksLab app is a separate, optional step if you want a routine built around your result and progress scans over time.
Is the attractiveness test biased by ethnicity?
It is built to avoid one known bias. Averageness is compared with published values from nine population groups, and your face is scored against the group whose typical values are closest, so it is not marked down for being far from one group's average. This is not an ethnicity guess. The reference samples are small, though, and their authors call the study preliminary.
How does this score compare with the PSL scale?
PSL is a 0–8 rating scale from looksmaxxing forums. The LooksLab PSL scale test translates this same measured score onto that scale with a fixed mapping, so a typical face lands near the PSL midpoint and both results come from one measurement. PSL ratings from other sites use their own methods, so they cannot be compared directly with either number.
Can a test rate my body or voice attractiveness?
Not this one. It measures only face shape, from landmarks placed on one front photo. Body shape, voice, style and how you move all affect how people see you, and a still face photo cannot capture them. Research on shared and personal taste also shows that no single score predicts how one particular person will see you.