
Your golden ratio result in 30 seconds
The calculator above places 478 landmarks on your face, levels your head to the midline, and measures five ratios that the golden ratio canon says should equal 1.618. For each one you get your value, how far it sits from 1.618 and a match score. The average of the five is your golden ratio match out of 100.
The photo is measured in your browser and is never uploaded. The scores are app estimates of geometry. They are not an objective measure of your worth or a medical finding.
Two things make this result different. First, we only score ratios that landmarks can measure: no hidden hairline guesses. Second, we show the proportions that research found to matter more than 1.618, so you can see both sides.
What is the golden ratio?
The golden ratio, written φ (phi), is about 1.618. Euclid defined it as dividing a line so that the whole is to the longer part as the longer part is to the shorter part. Solve that and you get (1 + √5) ÷ 2 = 1.6180339…
In the 1850s the German writer Adolf Zeising called the golden section a universal law of beauty, fully realized in the human body. Many claims that followed do not survive measurement. A 2024 review in Maxillofacial Plastic and Reconstructive Surgery notes that measurements do not support the famous Parthenon claim, and that there is no sign Leonardo da Vinci used the golden ratio in his drawings of human proportions (Naini 2024).
In faces, the idea became popular through the orthodontist Robert Ricketts, who proposed in 1982 that facial beauty could be measured with phi (Ricketts 1982), and through Stephen Marquardt's "phi mask", a face template built from golden proportions (Marquardt 2002).
The five ratios this calculator measures
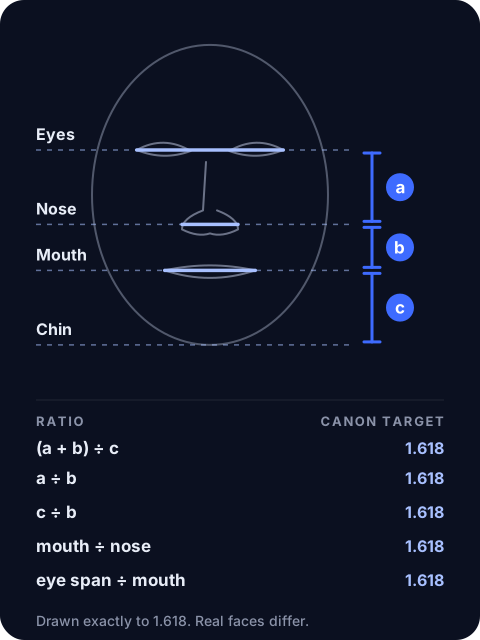
We use the frontal points from Ricketts' method as applied in a 2016 study of attractive adults (Khan et al. 2016): the outer eye corners, the outer edge of the nose, the mouth corners and the soft-tissue chin. The vertical gaps between those four levels are a (eyes to nose), b (nose to mouth) and c (mouth to chin).
| Ratio | How it is built | Canon target | Attractive adults in Khan et al. 2016 |
|---|---|---|---|
| Eyes–mouth ÷ mouth–chin | (a + b) ÷ c | 1.618 | Women about 1.61 |
| Eyes–nose ÷ nose–mouth | a ÷ b | 1.618 | Women about 1.65 |
| Mouth–chin ÷ nose–mouth | c ÷ b | 1.618 | Women about 1.69 |
| Mouth ÷ nose width | mouth corners ÷ nose width | 1.618 | Women 1.32, men 1.21 |
| Eye span ÷ mouth width | outer eye corners ÷ mouth | 1.618 | Women 1.98, men 1.90 |
That study selected 130 attractive North Indian adults (65 women, 65 men) with a rating panel. Five of the women's seven height ratios landed near 1.618, but only two of the men's did (both of them hairline ratios), and the width ratios missed 1.618 in both groups. The width values were closer to 1.414, the so-called silver ratio. All five ratios count toward your score, and any of the five can be named as your biggest opportunity, as explained below.
How each point is found:
- Eyes: the outer eye corners (MediaPipe landmarks 33 and 263).
- Nose: the widest point of the nostril wings (64 and 294). The same points give the nose width.
- Mouth: the mouth corners (61 and 291).
- Chin: the lowest point of the chin on the midline (152).
The calculator first rotates the landmarks so the line from the forehead (10) to the chin (152) is vertical. That removes head tilt, so a leaning head does not change the vertical gaps.
How to read your score
Each ratio gets a match score: 100 at exactly 1.618, minus 2 points for every 1% it sits away. A ratio 5% above 1.618 scores 90; one 20% below scores 60. Your golden ratio match is the average of the five.
| Match | What it means |
|---|---|
| 90–100 | Your ratios are on average within 5% of 1.618 |
| 80–89 | Close: on average within 10% |
| 65–79 | Mixed: some ratios close, others clearly off |
| Below 65 | Your face follows its own proportions, not the canon |
Each ratio is also colored. Green means within 5% of 1.618, blue within 12%, and orange further out. Orange is a description, not a flaw: the mouth ÷ nose width ratio is orange for many faces, including both attractive groups above. A face with exactly the average ratios of the attractive women in that study would score about 81: 99, 96 and 91 on the height ratios, but 63 and 55 on the width ratios.
Keep one distinction in mind. The match score measures closeness to one number. It does not measure attractiveness. Because 1.618 explains little of how attractive faces are rated, a face can score 70 and still be rated attractive, and a face can score 90 without standing out. For a result built on the factors with better evidence, take the attractiveness test.
How your biggest opportunity is chosen
Under the score, the result names one ratio as your biggest opportunity: the one of the five that sits furthest from 1.618, whether it is a height ratio or a width ratio. The title gives the ratio and your value, such as "Mouth ÷ nose width: 1.31 vs 1.618", and the text says which gap is long or short compared with the canon and what can and cannot change. The same ratio is marked "Furthest" in the ratio list.
Being 10% above 1.618 counts the same as being 10% below it. That is how the canon works, but research gives some directions a clear meaning, and the result says so:
- Mouth ÷ nose width below 1.618 is the usual pattern. The attractive adults in Khan et al. averaged 1.32 (women) and 1.21 (men), so on most faces this is the ratio furthest from 1.618.
- Eye span ÷ mouth width above 1.618 is also the usual pattern: the same groups averaged 1.98 and 1.90.
- A longer lower face is more common in men. In a 3D study of 272 Turkish and Japanese adults, the women in both groups had a shorter lower face than the men (Tanikawa et al. 2021). A lower-face ratio off 1.618 in that direction is often a sex difference, not a flaw.
- Pupil gap ÷ face width is compared with the 46% average described below, and the result says whether your eyes are wider-set or closer-set. In that study ratings peaked at the average, so neither direction is favored.
Why face length ÷ width is not scored
The best-known golden ratio claim is that a beautiful face is 1.618 times as long as it is wide, measured from the hairline to the chin. That ratio needs the hairline. The face mesh used here has no hairline point, and hair often hides the hairline anyway. The top landmark of the mesh (10) sits on the upper forehead, below the hairline.
So the calculator shows face length ÷ width with a plus sign, such as 1.18+. Your real hairline-to-chin ratio is higher than that number by an amount a photo cannot tell us. Any tool that scores this ratio against 1.618 from landmarks is either guessing where your hairline is or comparing a shorter length with a target that assumes a longer one.
If face length and width are what you care about, the face shape detector reads the same widths as a shape (oval, round, square, heart or oblong), which is more useful than a single ratio.
What research says about the golden ratio and beauty
The golden ratio has been tested directly, and the results are weak.
- Few golden proportions predict ratings. Kiekens and colleagues had 76 lay raters score photos of 64 adolescents, then measured 19 golden proportions from Ricketts' method. Only 4 of the 19 related to the ratings, and together they explained 16% of the variance, which the authors called too small to be of clinical importance (Kiekens et al. 2008).
- The phi mask fits a narrow face type. Holland found that Marquardt's mask best describes the proportions of masculinized white women as seen in fashion models, is poorly suited to many non-European faces, and uses a faulty method to judge fit (Holland 2008).
- Some studies find a link. Pancherz and colleagues measured cover models and former orthodontic patients and found that attractive faces deviated less from the divine values than non-attractive ones (Pancherz et al. 2010). The evidence is mixed, not zero.
- The current verdict. A 2024 review concluded that there is no convincing evidence that the golden ratio is linked to idealized human proportions or facial beauty, and no evidence to support its use in facial surgery planning (Naini 2024).
The "new golden ratios": what matters more
In 2010, Pallett, Link and Lee took a different approach. They edited photos of women's faces so that only the spacing of the eyes and mouth changed, and asked people to compare them. For each face, attractiveness peaked when the vertical distance between the eyes and the mouth was about 36% of face length (hairline to chin), and the distance between the pupils was about 46% of face width (between the inner edges of the ears). These values matched the average of 40 faces, and they were significantly different from the golden ratio values (Pallett, Link & Lee 2010).
The calculator shows your version of the second ratio under the result: pupil distance ÷ face width, against the 46% average. It is an approximation, because we measure face width at the face outline at eye level, not between the ears. The 36% ratio needs the hairline, so we do not measure it. The study used only white women's faces, and the authors note that the ideal may differ for men and other groups.
The broader research points the same way. A review with meta-analyses found that averageness, symmetry and sexual dimorphism are attractive in both men's and women's faces and across cultures (Rhodes 2006). To check those directly, try the face symmetry test or see where your geometry lands on the PSL scale.
Limits of any photo measurement
Photo ratios are sensitive. These are the main sources of error:
- The hairline. It is not visible to landmarks, which is why face length is not scored.
- Lens distortion. A phone held close exaggerates what is nearest to it. A model from Rutgers and Stanford researchers estimated that a selfie taken about 12 inches away makes the base of the nose look about 30% wider than a photo taken from 5 feet (Ward et al. 2018; Rutgers summary). A wider nose lowers your mouth ÷ nose ratio.
- Pose. Head tilt is corrected, but turning left or right and tipping the chin up or down change the gaps. The calculator warns you when your head is turned.
- Expression. A smile or open mouth moves the mouth corners. The result adds a note when it detects one.
- Short segments. The nose-to-mouth gap (b) is short, so a shift of one or two pixels in a small photo can move a ratio that uses b by several percent. Take two photos in the same setup and compare before you read much into a single number.
What you can and cannot change
No exercise or skincare routine moves your eye, nose and mouth levels. What changes is how your proportions read in person and in photos:
- Outline. Hair and facial hair change where the face seems to start and end. Pallett and colleagues suggested this is one reason a hairstyle can make the same face look more or less attractive: it changes the perceived face length and width.
- Lower face. Body fat changes how defined the jaw and cheek edges look, and with them how long the lower face seems.
- Eye area. Brow shape and under-eye care change how the eye region reads. The canthal tilt test measures the angle of your eye corners.
- Photos. Camera distance and height change the measured ratios themselves, as shown above.
Treat an orange ratio as a styling cue, not a verdict. The LooksLab app turns measurements like these into a routine for skin, jawline, hair, eye area and more.
How to take a good photo for this test
Use a front photo with your head level, your face relaxed and your mouth closed. Hold the camera at eye level and at least an arm's length away, or ask someone to take it from further back. Pull your hair off your face so the outline is visible, and use soft, even light. Our guide to taking photos for face analysis covers each step.
Frequently asked questions
What is the golden ratio face?
It is the idea that the most attractive faces repeat the number 1.618 (phi) in their proportions, for example mouth width being 1.618 times nose width, or the eyes-to-mouth distance being 1.618 times the mouth-to-chin distance. The orthodontist Robert Ricketts proposed it in 1982, and Stephen Marquardt's phi mask made it popular. It is a proposed rule, and studies that measured real faces give it weak and mixed support.
How do I calculate the golden ratio of my face?
Upload a front photo to the calculator above. It finds 478 landmarks, levels your head and divides five pairs of distances, then compares each result with 1.618. By hand, mark the outer eye corners, the widest point of the nose, the mouth corners and the bottom of the chin on a straight photo, measure the vertical gaps between them and divide as shown in the ratio table.
What measurements are used for the golden ratio face?
This calculator uses the frontal points from Ricketts' method: the outer eye corners, the outer edge of the nose, the mouth corners and the bottom of the chin. From the vertical gaps between them it builds three height ratios, and from the widths it builds mouth ÷ nose width and eye span ÷ mouth width. Other versions add the hairline and temples, which a face landmark model cannot see.
Is the golden ratio face real?
The number is real, but its link to beauty is weak. A 2024 review found no convincing evidence that the golden ratio is linked to facial beauty, and in a study of 64 adolescents only 4 of 19 golden proportions related to attractiveness ratings. Other traits, such as averageness and symmetry, have stronger research support.
What is a good golden ratio face score?
There is no pass mark. A score of 80 means your five ratios sit, on average, about 10% from 1.618. A face with the average ratios of the attractive women in one study would score about 81, because even those faces miss 1.618 on the two width ratios. The score says little about how your face looks to other people.
Is my face less attractive if my golden ratio score is low?
No. The score measures distance from one number, and that number explains little of how faces are rated. In one study, golden proportions together explained 16% of the variation in attractiveness ratings, which the authors called too small to be of clinical importance. A face can score 70 and still be rated attractive, and a face can score 90 without standing out.
What is the golden ratio for a male face?
The canon uses the same 1.618 targets for men and women, and so does this calculator. In a study of attractive adults, only two of the men's height ratios landed near 1.618, both measured from the hairline, and their width ratios missed it as well. Men's faces also tend to have a longer lower face than women's, so a lower-face ratio off 1.618 in that direction is often a normal male trait.
Is the golden ratio different for women?
The target is the same number. Women's faces fitted it more closely in one study: five of seven height ratios of attractive women landed near 1.618, but their mouth ÷ nose width averaged 1.32. The 2010 'new golden ratios' of 46% and 36% also come from women's faces only, and a critique of the phi mask found it fits a narrow, masculinized female face type.
Who has the most golden ratio face?
Rankings that circulate online each use their own ratios, points and scoring, so their percentages cannot be compared with each other or with this calculator. Most of them measure public photos taken at unknown distances and angles, which alone changes the ratios. None of them is a peer-reviewed measure of beauty.
Why does the calculator not score face length to width?
The classic 1.618 length-to-width rule measures from the hairline to the chin. Face landmark models cannot find the hairline, so any length they report stops at the upper forehead. We show that ratio for context, with a plus sign, because your true hairline ratio is larger.
Can you change your face to match the golden ratio?
Not the bone proportions. What changes is how they read: body fat changes how sharp the jaw and cheek edges look, hair and facial hair change the outline, and brows frame the eye area. Chasing 1.618 itself is not a useful goal, because the research does not support it as a beauty target.
Why do my golden ratio results change between photos?
Small changes in the photo move the ratios. A phone held close makes the nose look wider, which lowers mouth ÷ nose width. Tipping the chin up or down changes the vertical gaps, and a smile moves the mouth corners. The nose-to-mouth gap is short, so one or two pixels can shift those ratios by several percent. Use the same distance, height and relaxed face each time.
Is there a golden ratio for the side profile?
Golden ratio proposals exist for the profile too, but this calculator reads a front photo only. In a side view one eye and one side of the mouth are hidden, so the width ratios cannot be measured and the height gaps shift with the angle. That is why the tool asks you to retake a photo when your head is turned.
What is the golden ratio face mask?
It is a face template built from golden proportions by Stephen Marquardt, often called the phi mask or Marquardt mask. People lay it over a photo to see how closely their features line up. A 2008 critique found that it best describes masculinized white female faces like those of fashion models, fits many non-European faces poorly and uses a faulty method to judge fit.
Is facial symmetry the same as the golden ratio?
No. Symmetry compares the left and right halves of the face. The golden ratio compares distances with one number, 1.618, whatever the two sides look like. Symmetry has better research support: a review with meta-analyses found symmetry, averageness and sexual dimorphism attractive across cultures. The face symmetry test on this site measures the left-right match directly.
Did Leonardo da Vinci use the golden ratio for faces?
There is no sign that he did. A 2024 review notes that Leonardo's drawings of human proportions do not use the golden ratio, and that measurements do not support the famous claim about the Parthenon either. Much of the link between phi and beauty goes back to the 1850s, when the writer Adolf Zeising called the golden section a universal law of beauty.
Why is the golden ratio 1.618?
Euclid defined it by dividing a line so that the whole is to the longer part as the longer part is to the shorter part. Solving that gives (1 + √5) ÷ 2, which is 1.6180339 and continues without end. It is written with the Greek letter phi (φ). Its use as a rule for beautiful faces came more than two thousand years later.
Are golden ratio face apps and filters accurate?
The distances are only as good as the photo, and the scores are not comparable between apps. Each app picks its own ratios and points, and some score face length from the hairline, which landmark models cannot see, so they guess it. Camera distance and pose change the numbers in every app. This calculator shows how each ratio is built, measures in your browser and does not score the hairline.